


Full-mixing geochemical models of As Pontes mine pit lake, Spain (Part I)
Por: Yanmei Li1*, Javier Samper2, Luis Montenegro2
Abstract
Fast filling method is used to fill an open mine pit after its operation in North-west of Spain. The filling waters are from precipitation water, collected tailing water, surface water from Eume River and groundwater. Three geochemical models are built using CORE2D V4 to simulate the water quality of the filling lake. At beginning there were three small lakes: East lake, Intermediate lake, and the West lake. The models are calibrated by profile data. As to the model results, there´s not precipitation of MnO2(s) in the chemical reaction process in this case. The calibrated models were used to simulate the continuing filling lake, and future full mixing of the entire lake, which is the basic for the appropriate management of the As Pontes mine pit lake.
Key words: Fast filling, Open mine pit lake, geochemical model, full mixing
Introduction
Fast filling of an open mine pit is a very practical method to fill an open mine pit after its operation with less time and better water quality and form a mine lake finally. Acid mine drainage (AMD) is an important world-wide environmental problem. The modelling and prediction are always difficult tasks. The As Pontes open pit mine in A Coruña was one of the largest coal mines in Spain. Mine and dewatering activities in As Pontes ended in December 2007. The coal mine dumps located outside the pit have a surface area of 11.4 km2. An artificial lake has been formed in the former open pit with runoff waters coming from the outside dumps, the drainage basin of the mine and with pristine waters diverted from the nearby Eume river. As Pontes dumps contain a wide variety of mine soils of various weathering stages and physical and chemical properties. Pyrite caused soil and water acidification during the construction of the dumps. Acidity promoted also the dissolution of large amounts of aluminum and iron. The runoff waters of the outside dumps are collected into the North and the South perimeter channels. Dump runoff waters were treated in the liquid-effluent treatment plant during mine operation. Since mine closure in December 2007, they are diverted to the open pit lake. Their water quality has improved over the last 20 years due to the remedial actions taken by ENDESA to achieve acceptable environmental conditions. The appropriate management of As Pontes dump waters and the need to predict the future time evolution of the water quality of the dumps waters require the use of hydrological and hydrochemical models (Samper et al., 2009).
Uhlmann et al. (2004) reported geochemical models to study acid mine water. They presented experimental and numerical models for a titration experiment performed on a water sample of Plessa acid mine Lake 111, Lusatia, Germany.
These models assume full mixing. The effect of lake stratification was analyzed by Samper et al. (2009) and Moreira (2010) who reported a coupled hydrodynamic and geochemical model of As Pontes lake. The models presented here were useful to develop the more sophisticated stratified models.
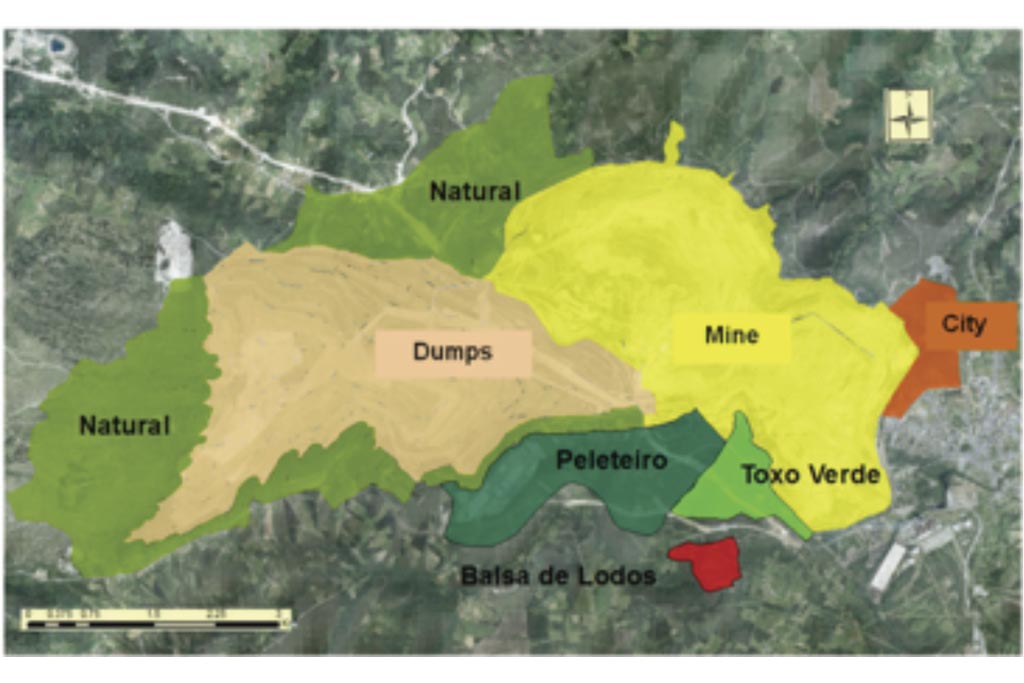
After the mine was closed, it was filled with water from the Eume river, the mine drainage, the dumps drainage, and the drainage of some natural areas (Peleteiro, Toxo Verde) (Figure 1).
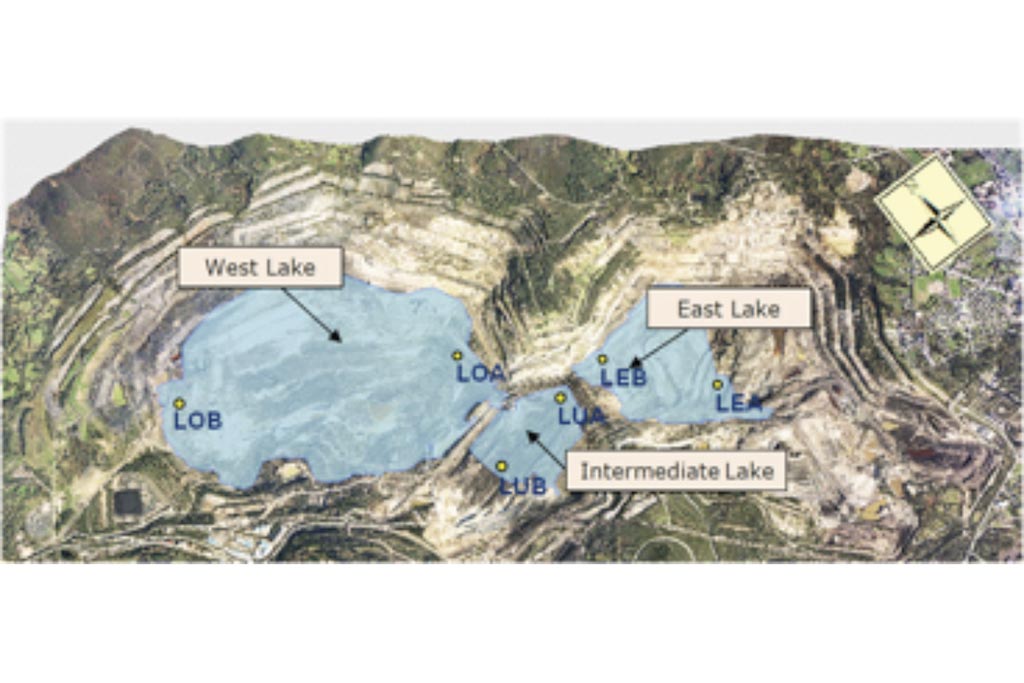
During the filling of the As Pontes mine, three independent small lakes were formed which are denoted here as East, West and Intermediate lakes (Figure 2). These three lakes merged into a single lake when the water level reached the elevation 261.5 m. The location of the lake sampling points is shown in Figure 2.
Numerical model
Geochemical system
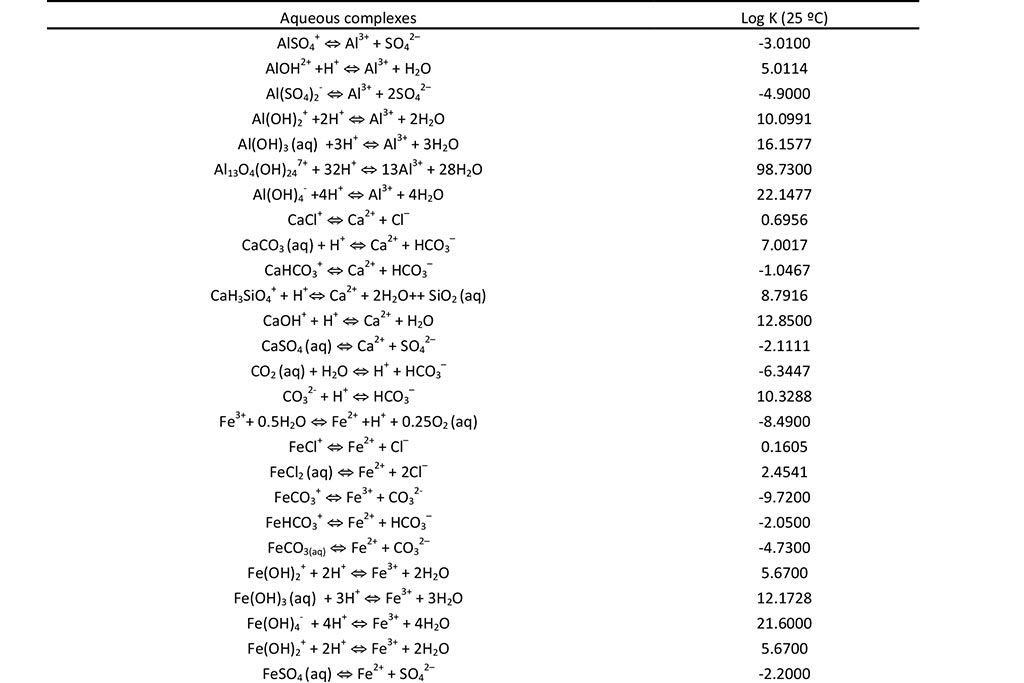
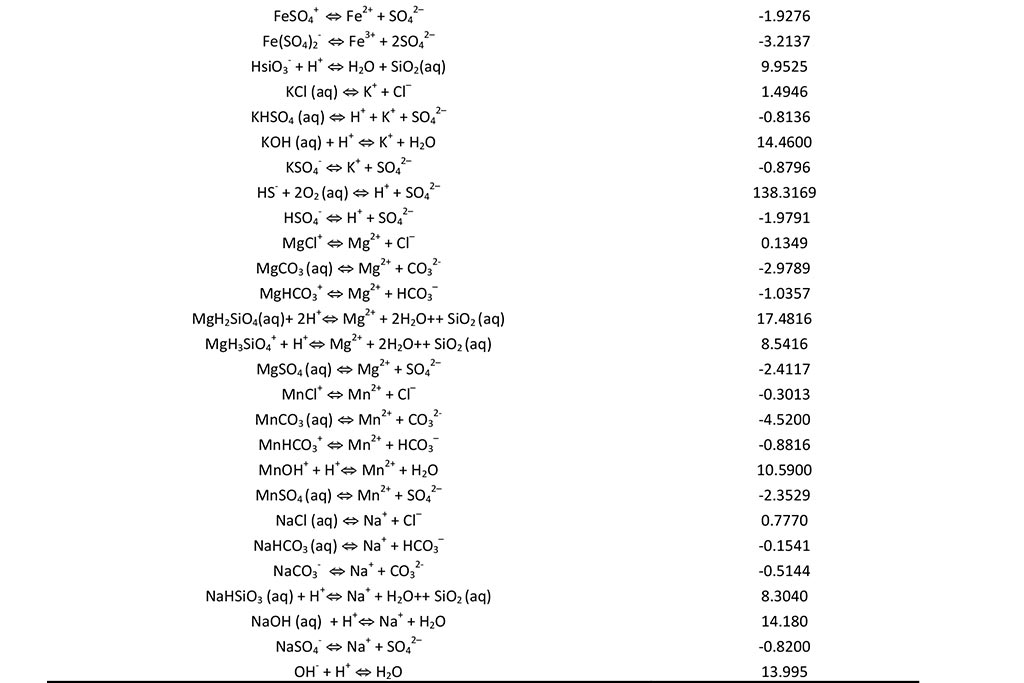
The geochemical model accounts for the following chemical processes: aqueous complexation, acid-base, redox, mineral dissolution/precipitation, gas solution/ex-solution and surface complexation. The sorption of solute at the solid surfaces is described as chemical reactions between the aqueous species and specific surface sites (surface complexation). These surface reactions include proton exchange, cation binding and anion binding via ligand exchange at surface hydroxyl sites (represented here as XOH). The chemical system is defined in terms of the following 17 primary species: H2O, H+, Ca2+, Mg2+, Na+, K+, Fe2+, Mn2+, Al3+, Cl-, SO42-, HCO3-, SiO2(aq), O2(aq), XOH (strong), XXOH (weak) and XXXOH (very weak). The relevant aqueous complexes were identified from speciation runs performed with EQ3/6 (Wolery, 1979). Aqueous complexes, minerals, gases and surface complexes used in the CORE2D V4 simulation are listed in Table 1 and Table 2. Ferrihydrite, schwertmannite and basaluminite are used in the model. They are assumed at chemical equilibrium. Their initial amount in the East and Intermediate lakes is 0. Therefore, only its precipitation is allowed. Four strong and two weak surface complexes are considered to buffer pH: XOH2+, XO-, XOMg+, XOCa+, XOH2+w and XO-w. The initial partial pressure of O2(g) is 10-0.7 atm.
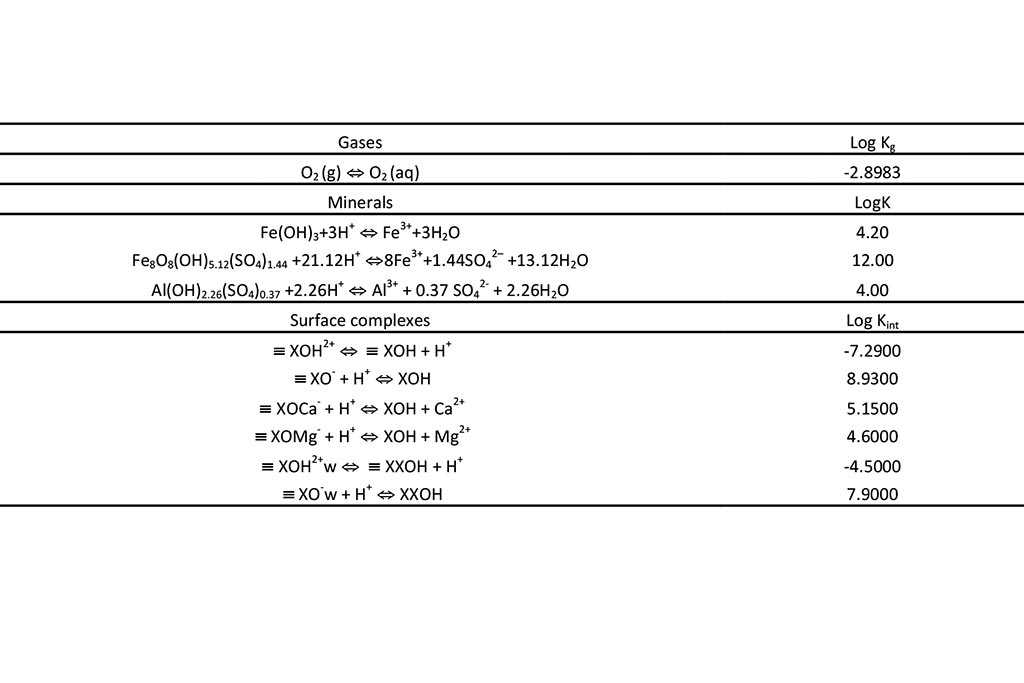
constants for surface complexes.
Table 3 lists the parameters of surface complexation which include: (1) Specific adsorbent surface (surface of the solid phase per unit volume of solution) and (2) Total sorption sites per unit volume of solution.
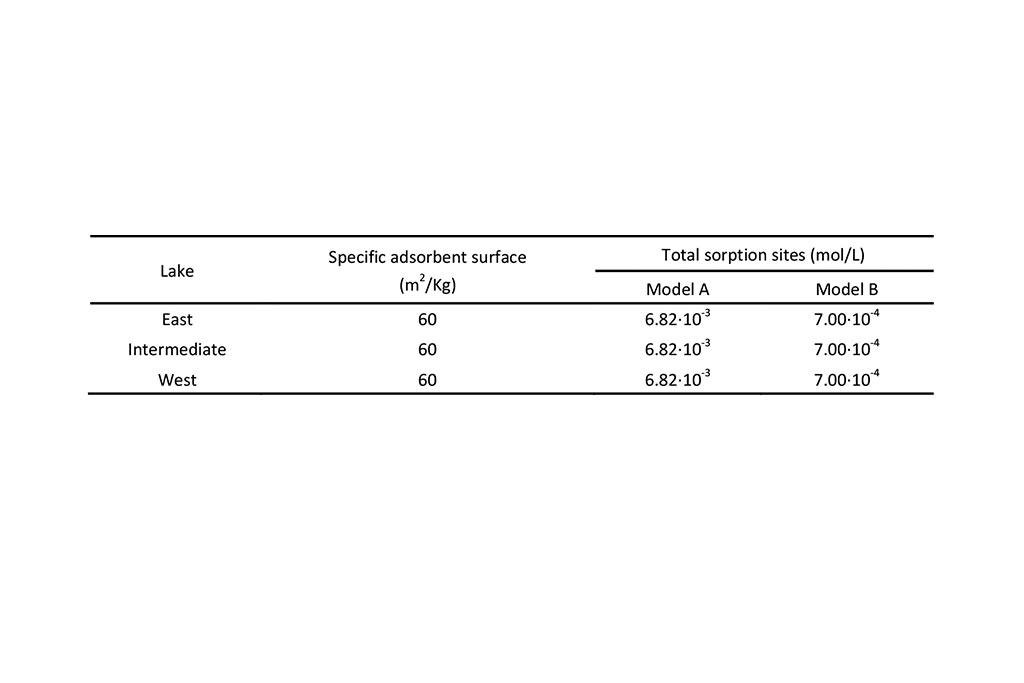
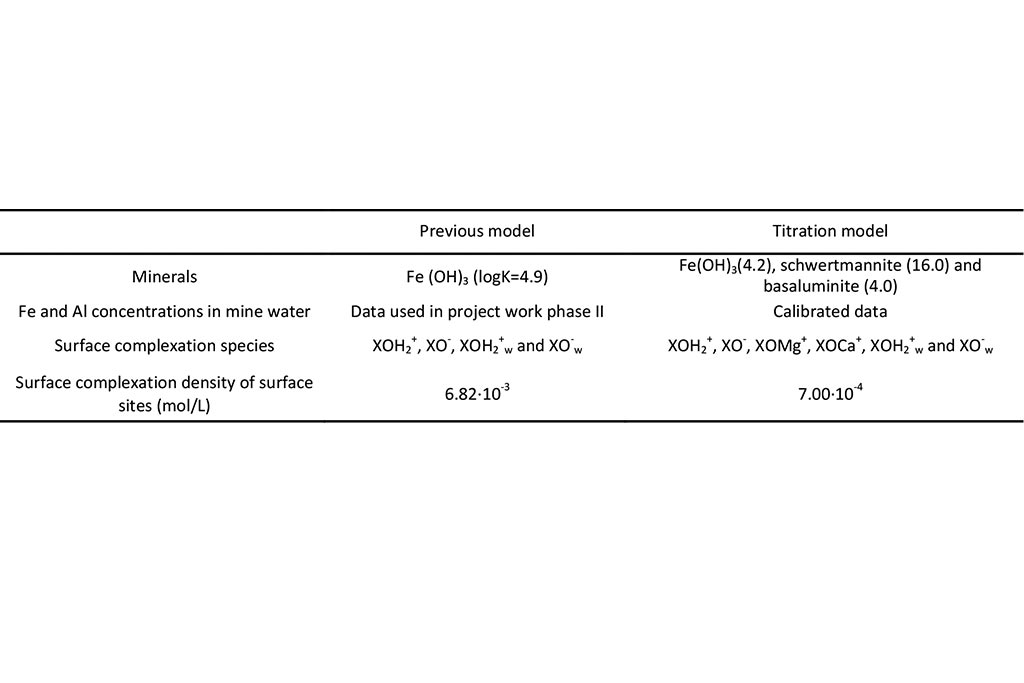
Model A is the previous model reported by Samper et al. (2008). Model B corresponds to the updated titration model (Li et. al., 2015).
A two dimensional transient reactive transport model was performed with CORE2D V4 (Samper et al., 2003). Only a material zone was considered in the system with an extremely large hydraulic conductivity and a porosity of 0.99.
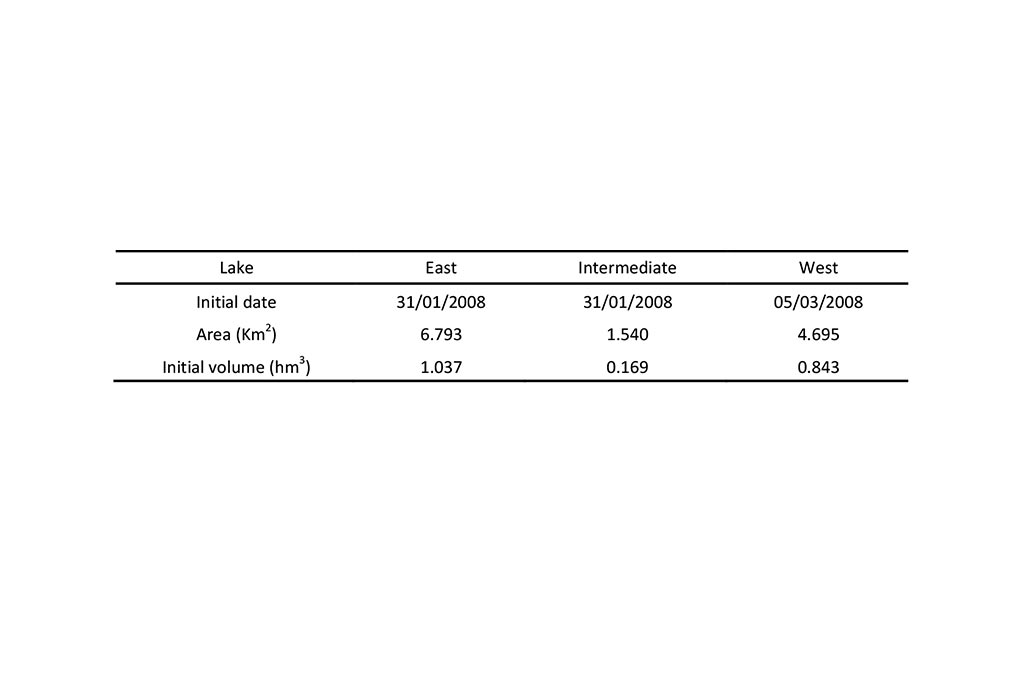
The simulation period goes from 31/01/2008 to 31/07/2009 for the East and Intermediate lakes and from 05/03/2008 to 31/07/2009 for the West lake.
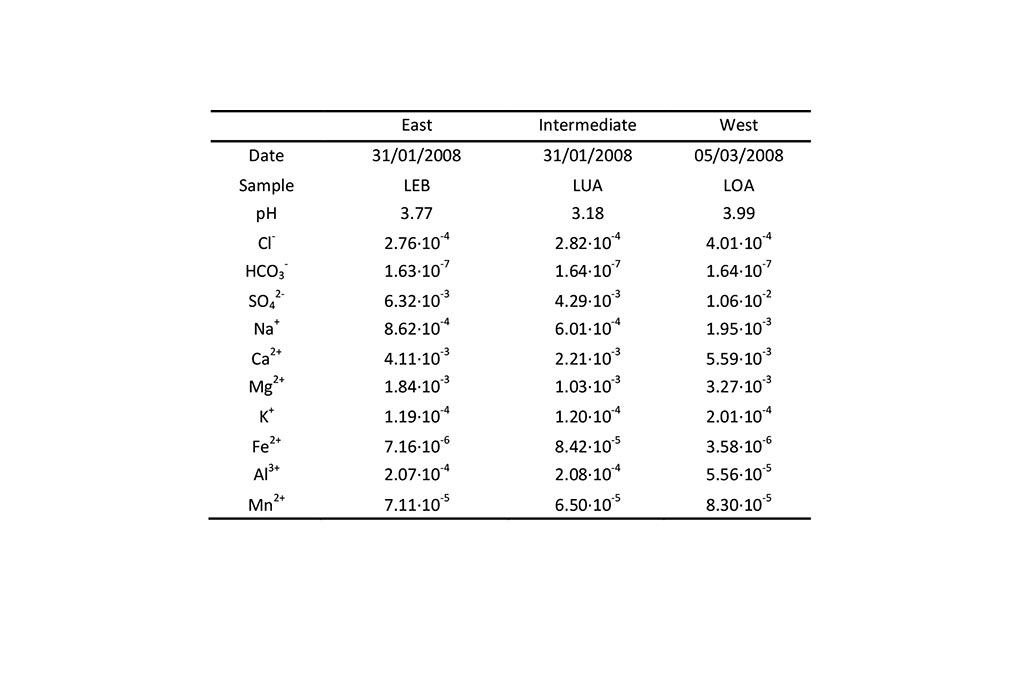
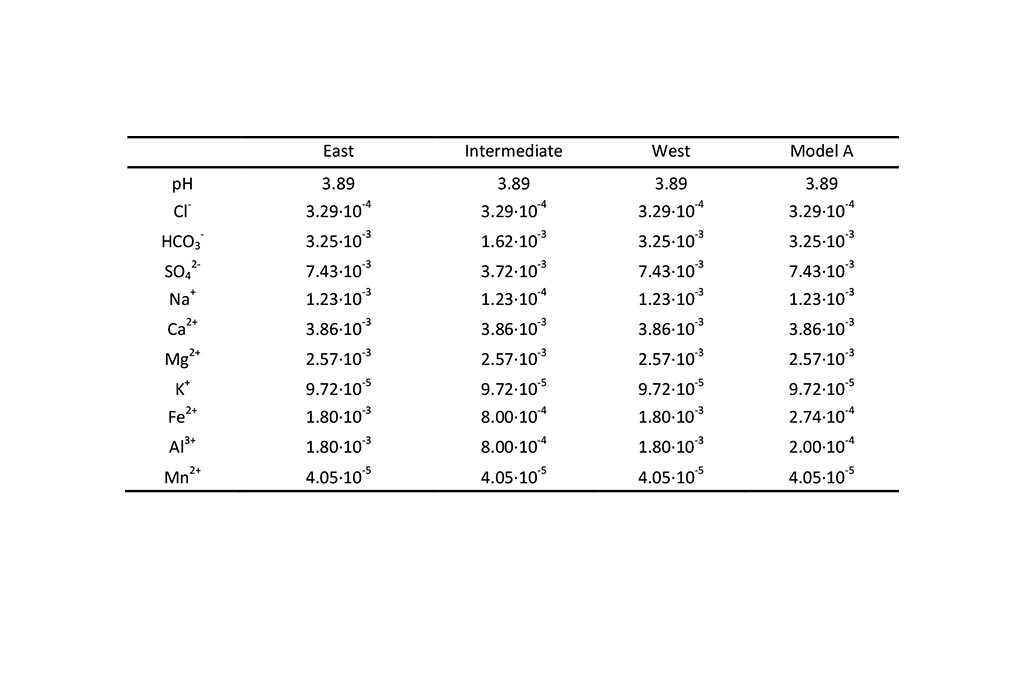
Initial conditions
The initial conditions in the three lakes are listed in Table 4 and Table 5.
Boundary conditions
The drainage of the outside dumps was used to fill the lake. The dumps drainage was calculated with VISUAL BALAN. Their catchment area includes the dumps and some nature basins (26.89 km2) (Figure 1). The total volume is 58.06 hm3 from 31/01/2008 to 31/07/2009.
The chemical composition of the dumps drainage was simulated by Ma (2010) with a coupled hydrological and chemical model of the dumps.
The second inflow is mine drainage. There is no vegetation to capture rainfall. This inflow was calculated from rainfall data. The measured chemical composition of the mine drainage is listed in Table 6.
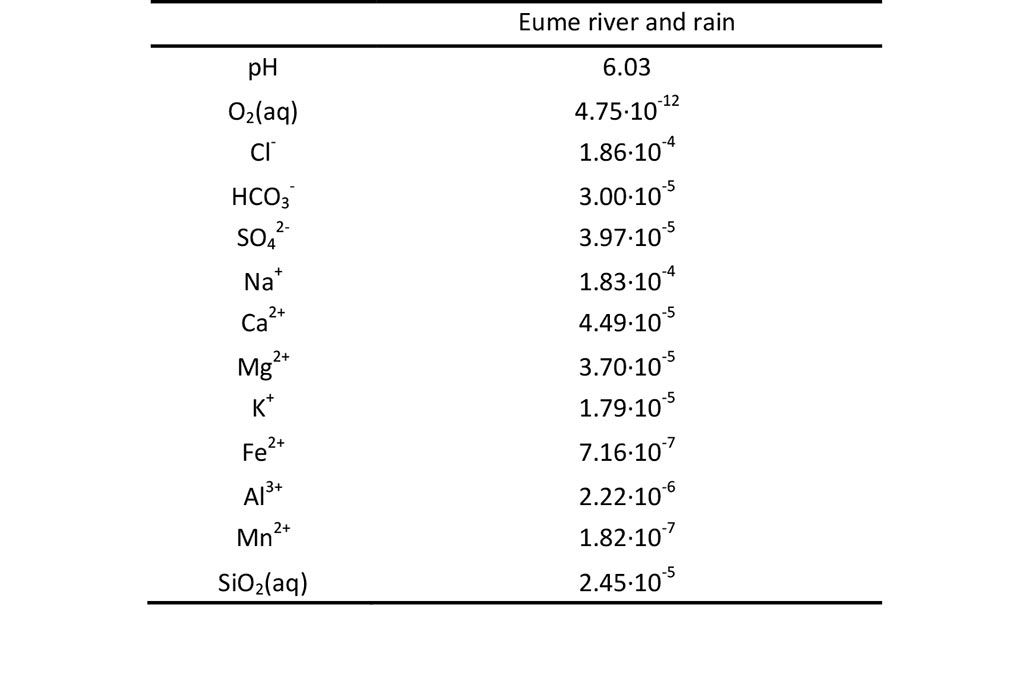
The chemical composition of Eume river water is listed in Table 7.
The lake evaporation was calculated using the estimated evapotranspiration of the dumps by Ma (2010) (Table 8).
Overflow takes place when the lakes are full. The East lake overflows into the Intermediate lake. Then, the Intermediate lake overflows into the West lake.
The time series of overflows was calculated by Moreira (2010) with a stratified model. The chemical compositions of the outflows were calculated by running the geochemical model. The outflows of a lake were used as inflows for the downstream lake.
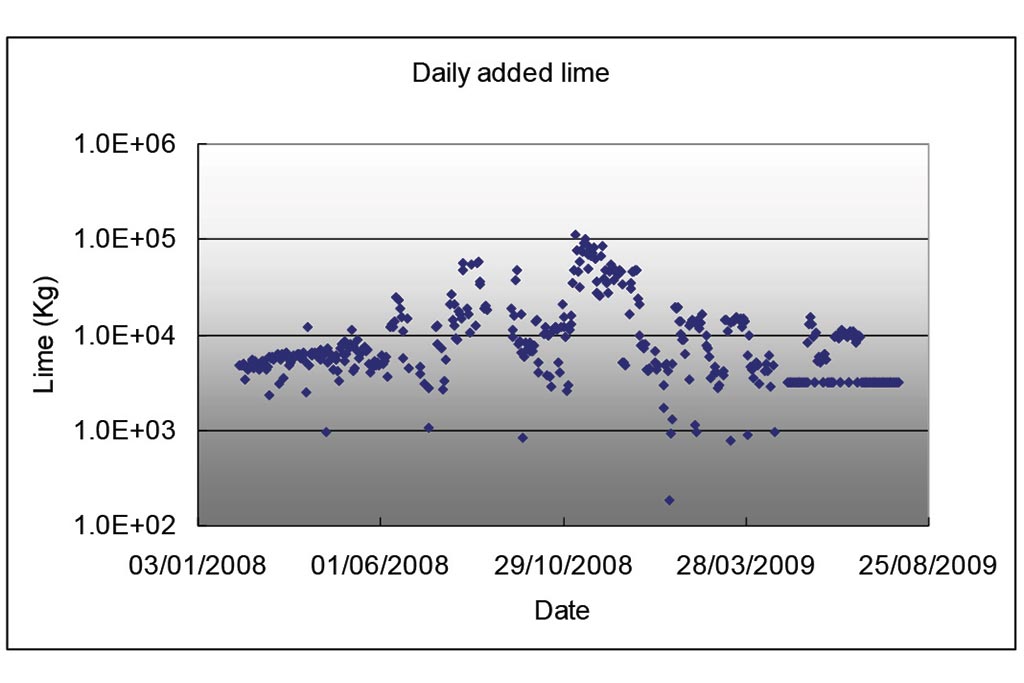
Lime was added into the East lake (Figure 3).
Alternative geochemical models
There are several candidate geochemical models for As Pontes lake water. Their main differences are listed in Table 9.
Model calibration
East lake
The East lake has the following inflows: dumps drainage, Eume water, rainfall and mine water. Eume water and rainfall are lumped into a single inflow. The outflows include the outflow to the Intermediate lake and the evaporation.
Speciation runs of measured data were performed with EQ3 to check for calcite and gypsum precipitation. Calcite precipitates when pH >9.5 and gypsum does not precipitate. However, in this model, calcite was not considered.
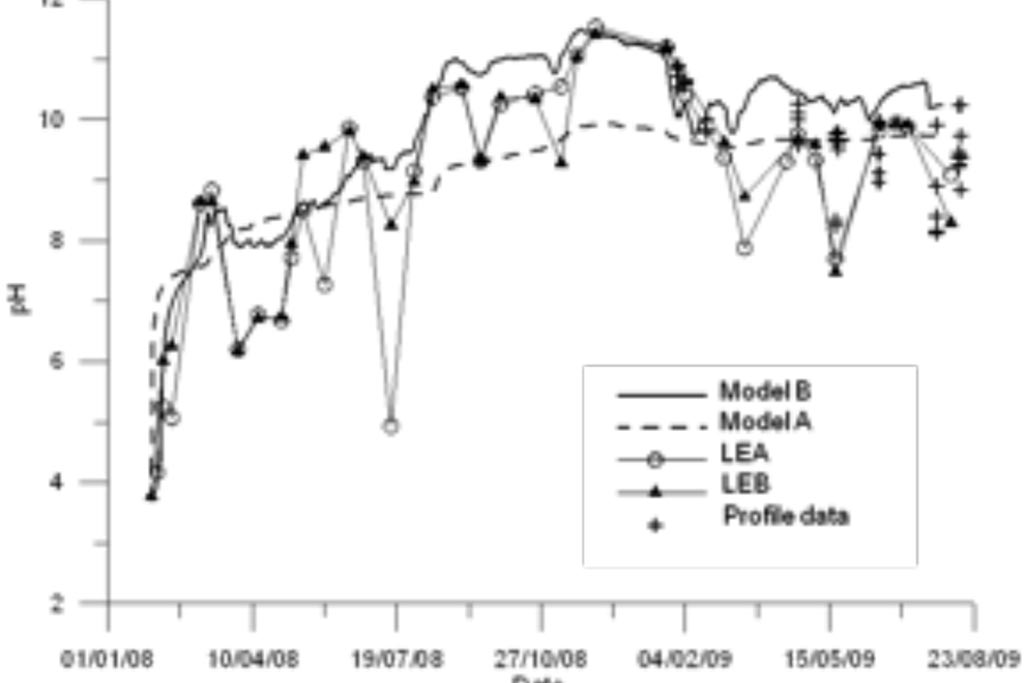
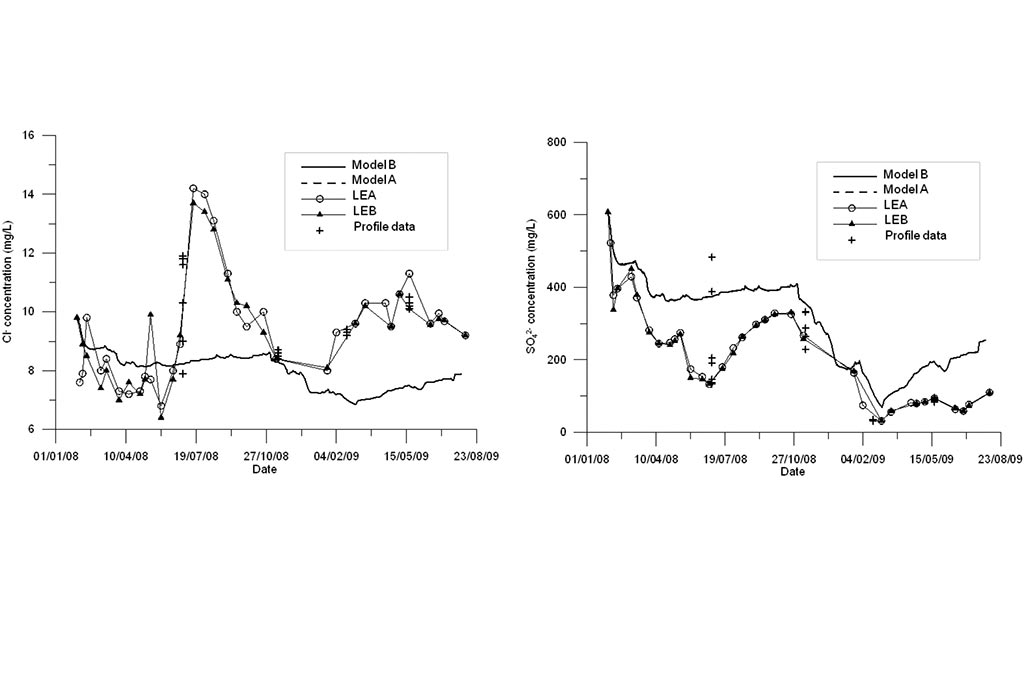
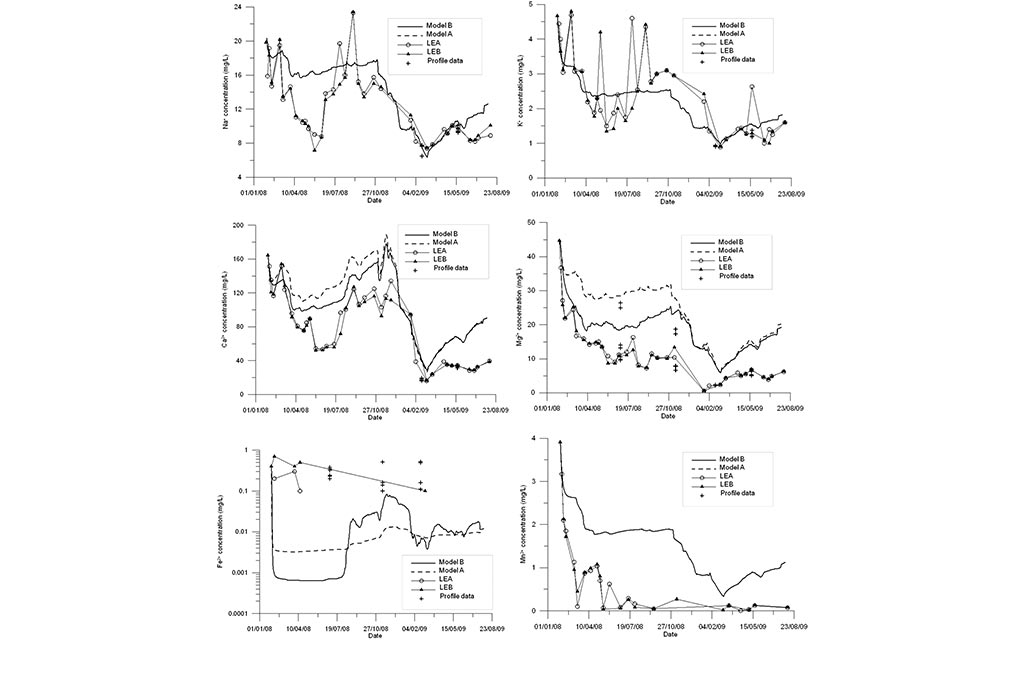
Model results are compared to measured data (Figure 4-Figure 6). Model results include the results of the standard geochemical model of Samper et al. (2008) (Model A) and those of the titration model (Model B). Measured data include LEA (East lake surface water in point A), LEB (East lake surface water in point B) and the vertical profile data recorded in three sampling dates.
One can see that the model captures the trends of measured data for all species except for Fe and Mn (Figure 6). Another run was performed in which MnO2(s) was allowed to precipitate. One can see in Figure 7 that the precipitation of MnO2(s) results in a slightly lower pH. MnO2(s) precipitation leads to an extremely small concentration of dissolved Mn (Figure 7). Therefore, MnO2(s) precipitation was discarded
Intermediate lake
The inflows of the intermediate lake include: the overflows of the East lake, rainfall and mine drainage. Its outflows include evaporation of the outflow to West lake.
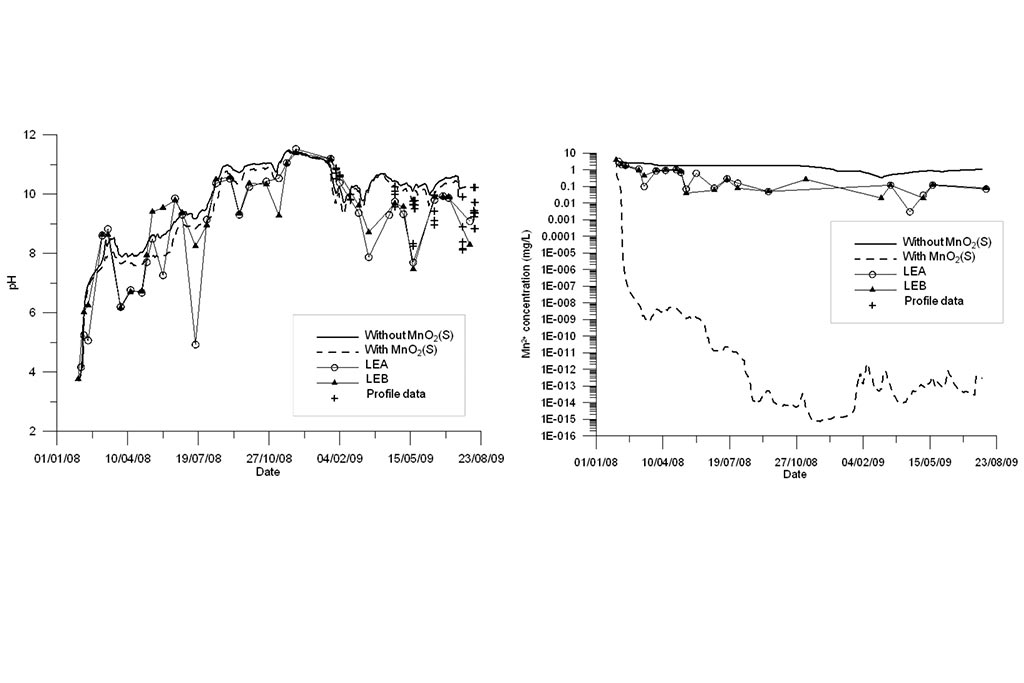
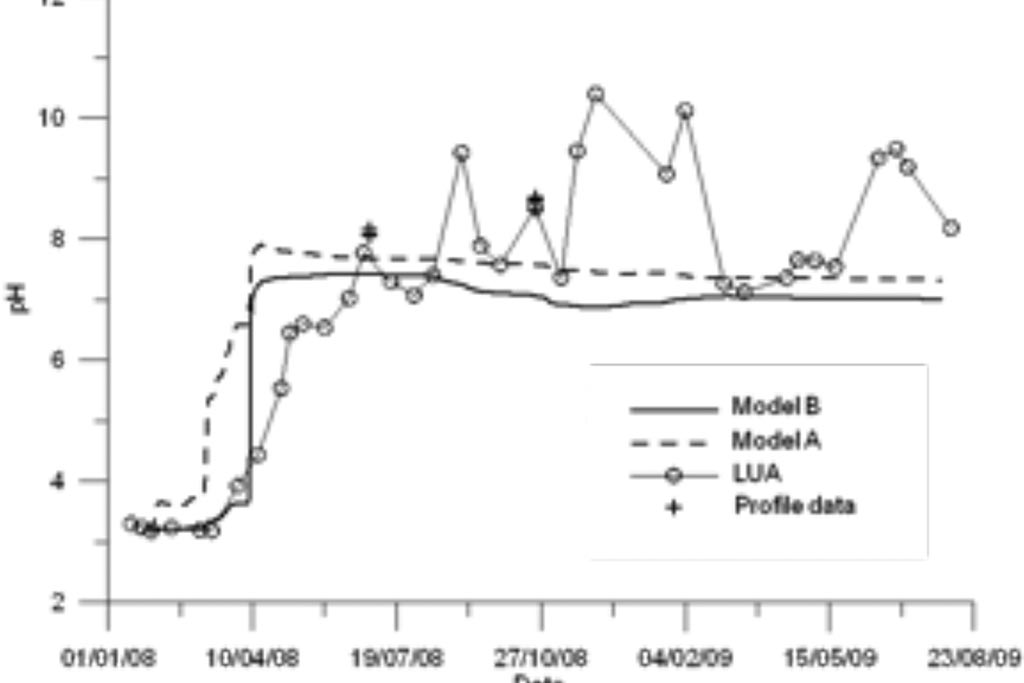
Figure 8. Measured (symbols and symbols with lines) and computed pH (lines) with the previous and updated models (A and B) for the Intermediate lake.
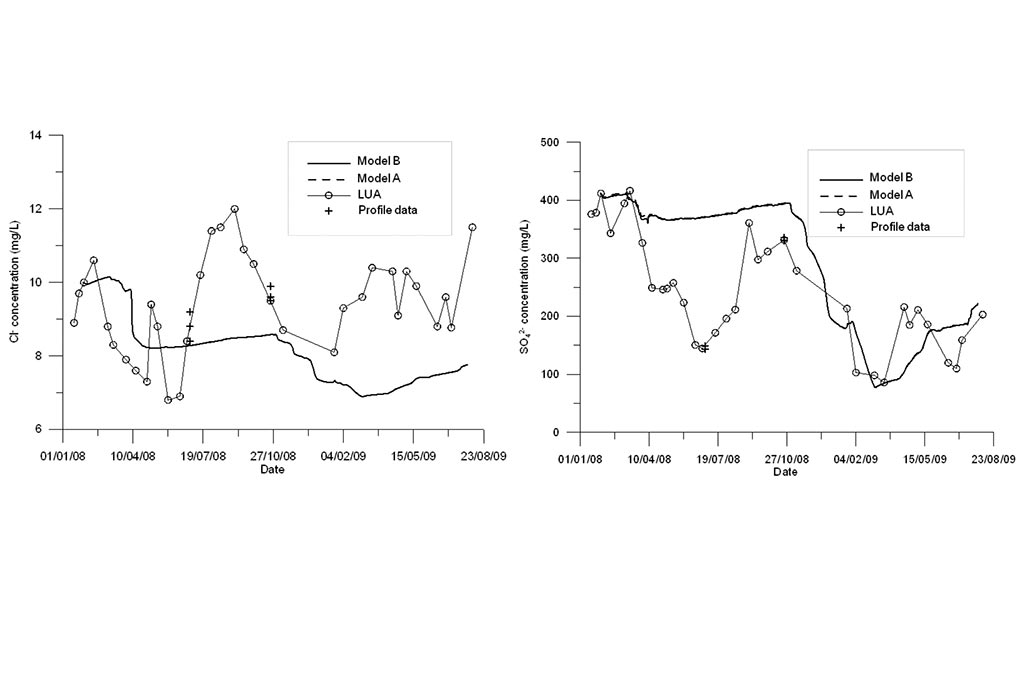
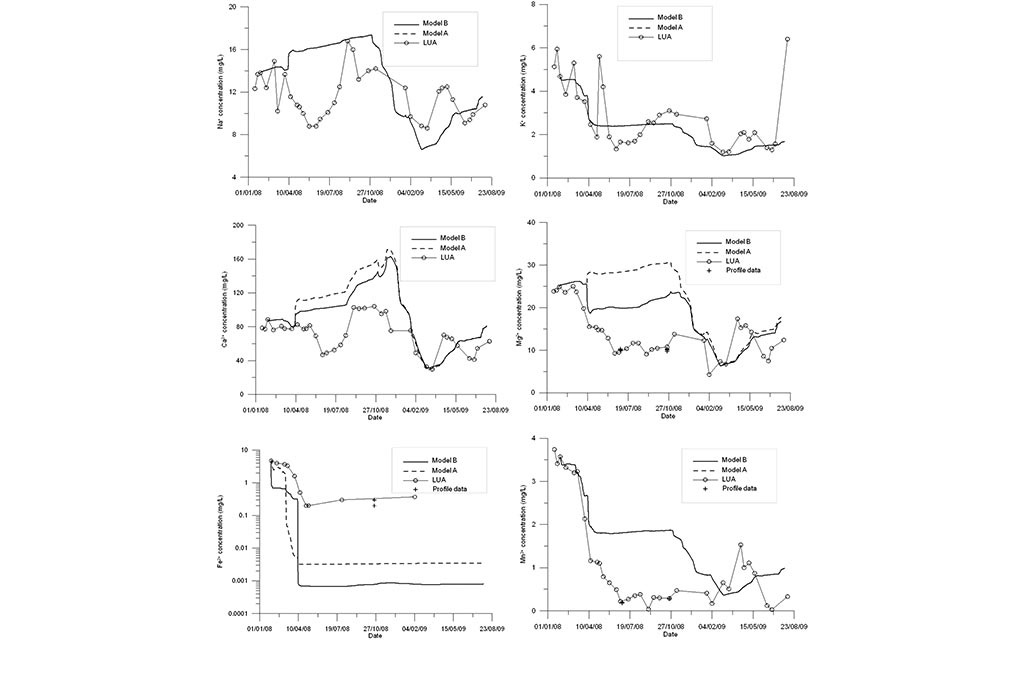
Model results are compared to measured data in Figure 8 to Figure 10. Again, model results are presented for the standard model (Model A) and the titration model (Model B). Measured data are available for the LUA sampling point and two vertical profiles. The model captures the trends of most chemical species except for Fe.
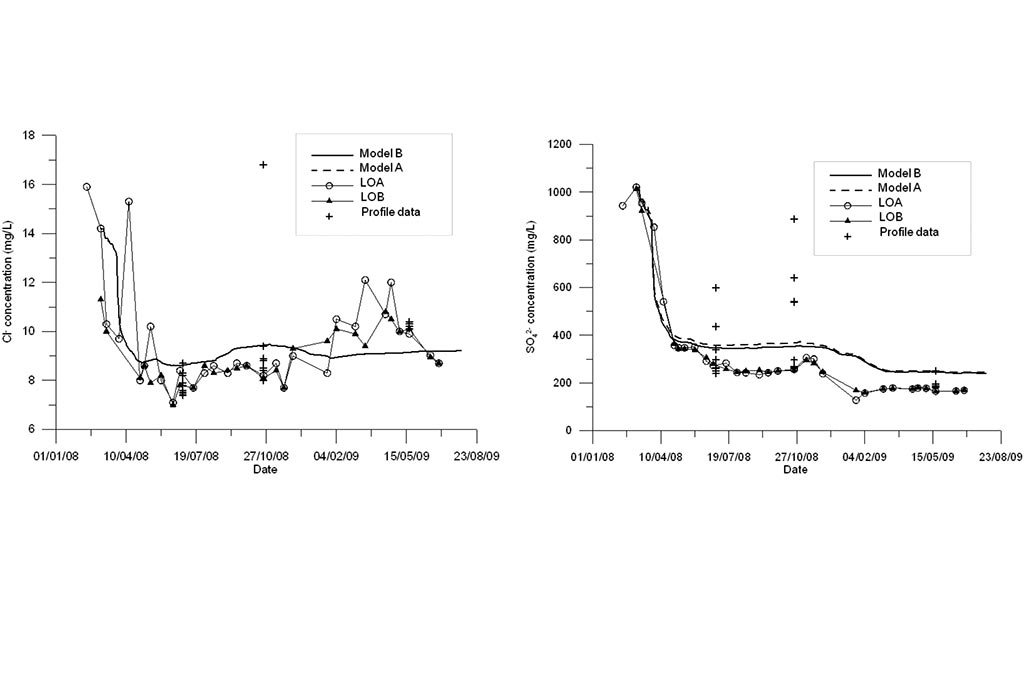
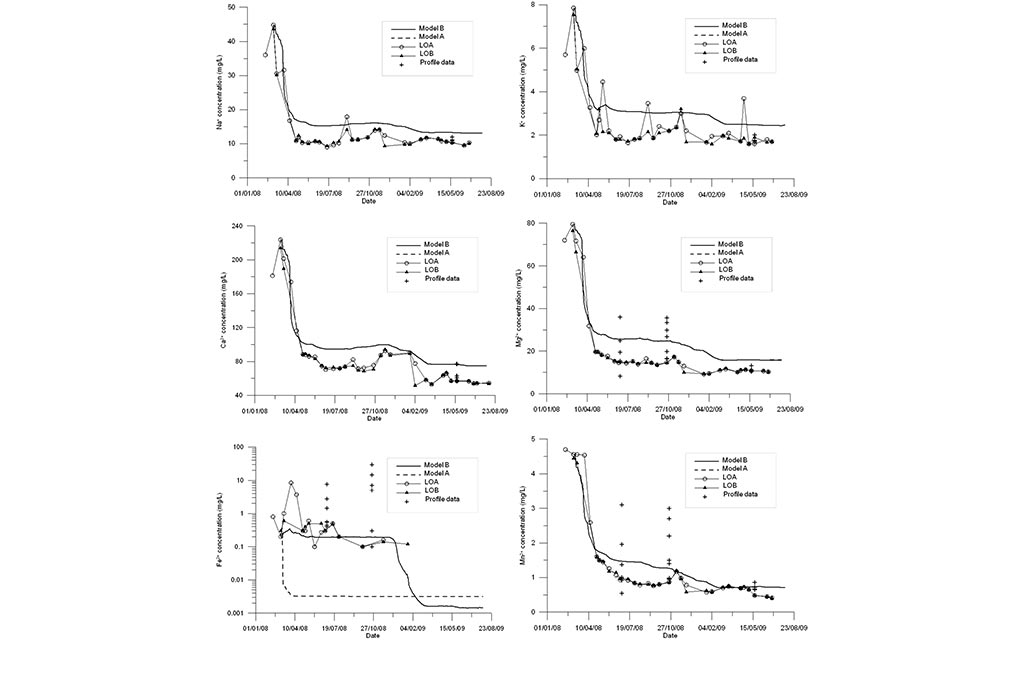
West lake
The West lake receives the following inflows: the overflow from the Intermediate lake, rainfall and the mine drainage. The only discharge is the evaporation.
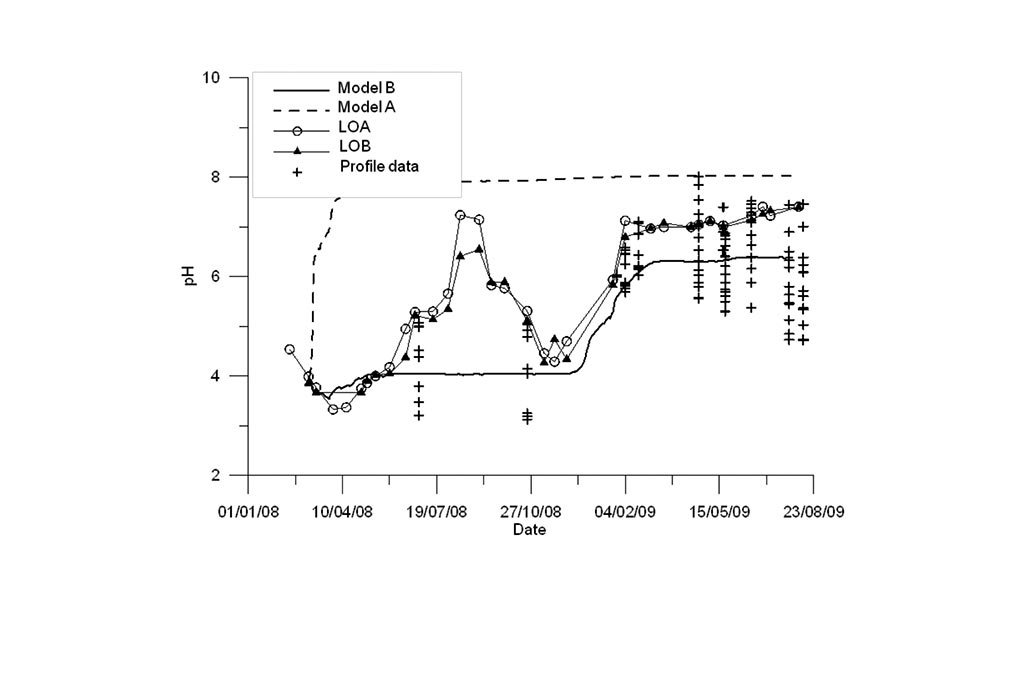
Model results are compared to measured data in Figure 11 to Figure 13. Model results are presented for the standard model (Model A) and the titration model (Model B). Measured data are available for LOA and LOB sampling points and two vertical profiles. One can see that the model B based on the titration model outperforms the standard model especially for pH and Fe.
Conclusions
The titration model improves the fit of pH and Fe data compared to the standard geochemical model of Samper et al. (2008). The model captures the trend of measured data for most of the species.
The precipitation of MnO2(s) results in a slightly lower pH, but the results for Mn clearly show that MnO2(s) precipitation leads to an extremely small concentration of dissolved Mn. Therefore, MnO2(s) precipitation must be discarded.
The concentrations of mine water drainage may decrease with time. The model of the East lake improves during the first half year and gets worse after 500 days and that of the West lake improves in the period of 300-500 days. The decrease of the concentrations may probably be less than 70%.
References
- Li, Y., Samper, J. and Montenegro L., 2015. Geochemical modeling of titrationexpe riments of acid mine waters, GEOMIMET. 316:21-26.
- Ma, H., 2010. Multicomponent reactive transport models for acid mine drainage and radioactive waste disposal. Ph.D. Thesis, Universidade da Coruña, A Coruña, 295 pp.
- Moreira, S., 2010. Coupled hydrodynamic and geochemical models for open pit lakes: Application to the As Pontes pit lake. Ph.D. Thesis, Universidade da Coruña, A Coruña.
- Samper, J., Yang, C. and Montenegro, L., 2003. User’s Manual of CORE2D: A Code for Groundwater Flow and Reactive Solute Transport. Universidade da Coruña, A Coruña, Spain.
- Samper, J., Moreira, S., Álvarez, D., Montenegro, L., Lu, C., Bonilla, M., López, C., Ma, H. and Li, Y., 2008. Modelo de flujo y calidad química del futuro lago de As Pontes. Fase 2: modelos de flujo y calidad de las aguas del lago, Informe final de la fase 2. 2 Tomos. Para ENDESA Generación, E. T. S. Ingenieros de Caminos. Universidad de A Coruña, A Coruña, España.
- Samper, J., Moreira, S., Montenegro, L., Ma, H. and Li, Y., 2009. Modelo hidrodinámico y de calidad química del Lago de As Pontes, Fase 3: mejora, contraste, revisión y actualización del modelo. Informe final del Proyecto MOD-AS PONTES, Universidade da Coruña, A Coruña, España.
- Uhlmann, W., Büttcher, H., Totsche, O. and Steinberg, C.E.W., 2004. Buffering of acidic mine lakes: The relevance of surface exchange and solid-bound sulphate. Mine Water and the Environment, 23(1): 20-27.
- Wolery, T.J., 1979. Calculation of chemical equilibrium between aqueous solution and minerals: The EQ3/6 software package. Technical Report UCRL-52658, Lawrence Livermore National Laboratory, CA, USA.
- 1 Departamento de Ingeniería en Minas, Metalurgia y Geología, Universidad de Guanajuato, 36000, Guanajuato, Gto., Mexico
- 2 ETS ICCP Universidad de A Coruña. Campus de Elviña, ES-15192, A Coruña, Spain.
- * Corresponding author: Yanmei Li, yanmeili@ugto.mx


